Dwarshuis


Melieke de Honingbij
De Stichting Archivalia Post & Hamers heeft vriendelijk toestemming gegeven voor digitale publicatie (voorheen op allesoverbijen.nl).


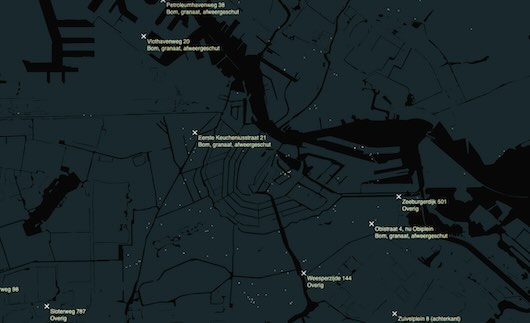
Wolf in Nederland op de kaart
Meldingen van wolven en andere jachtdieren die huisdieren doden (2017 – 2025). Een interactieve visualisatie.

GIJN about Dwarshuis
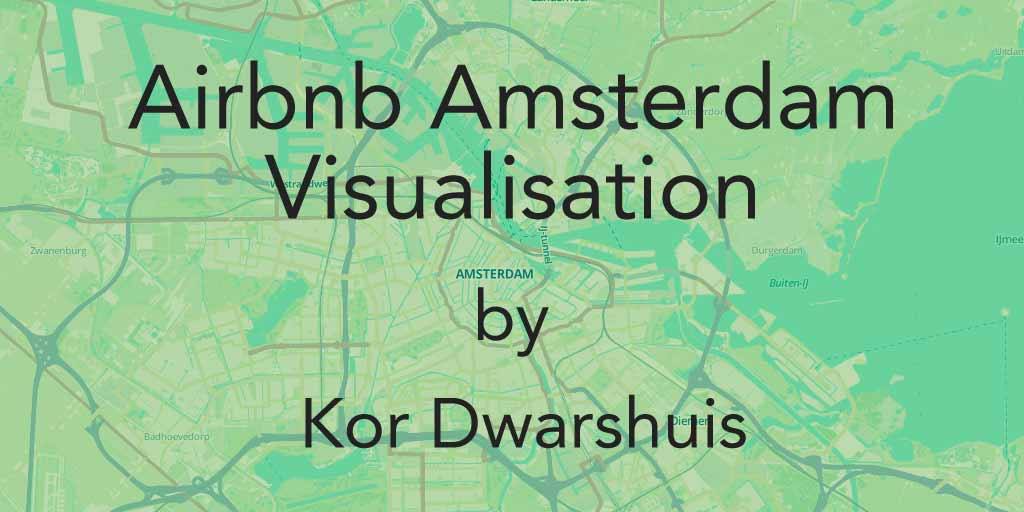
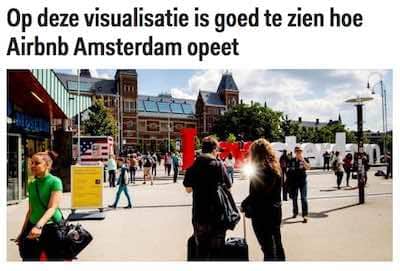
“This Week’s Top Data Journalism. Dwarshuis illustrates the Airbnb phenomenon in Amsterdam since the company launched.”

Business Insider about Dwarshuis
“Graphic designer Kor Dwarshuis created a visualization showing chronologically the growth of the number of newly registered Airbnb properties in Amsterdam (translated from Dutch).”
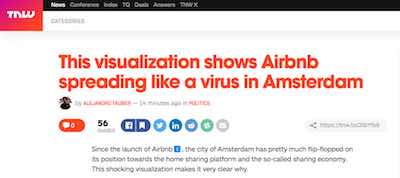
TNW about Dwarshuis
The Next Web: “But in the past year or so, that stance has completely reversed – and thanks to this visualization by Dutch data visualizer and animator Kor Dwarshuis, it’s not hard to see why.”